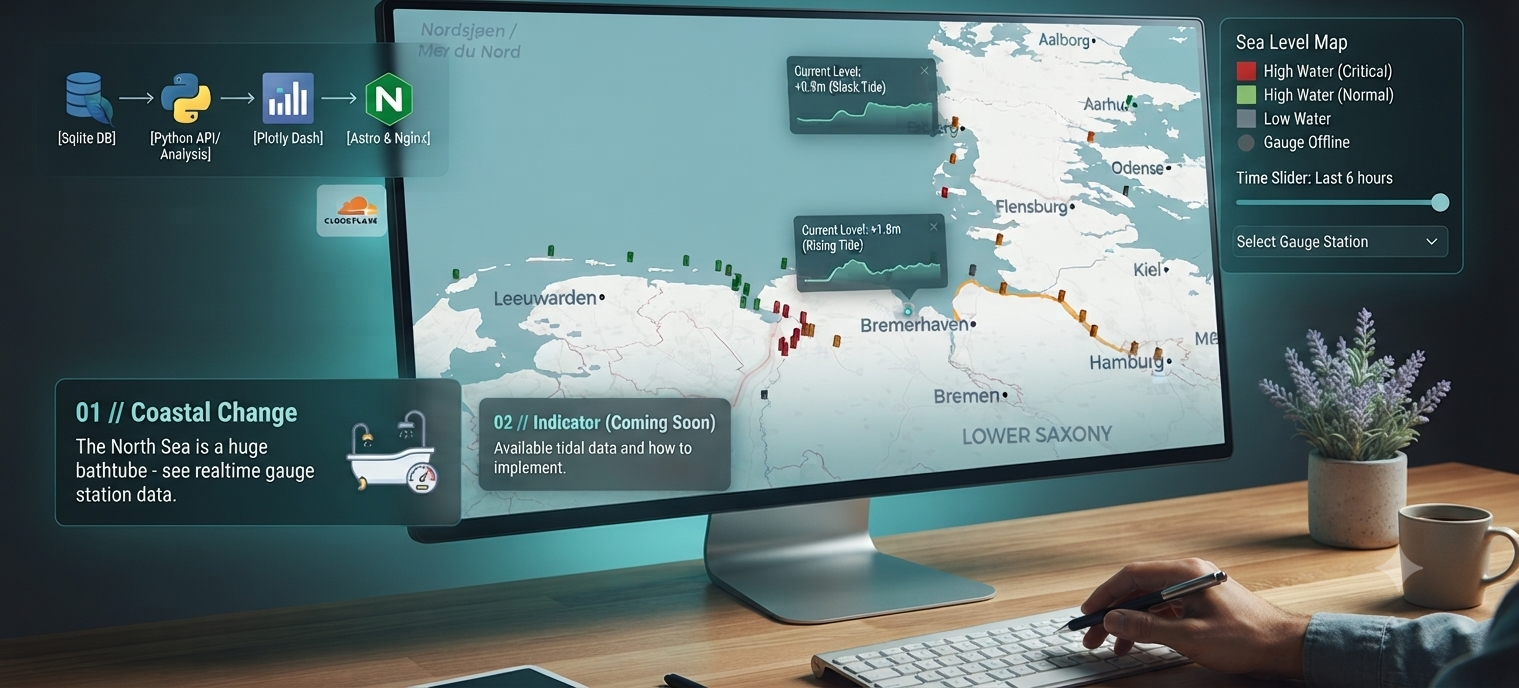
Interactive Sea Level Map Project: Tidal Dynamics of the North Sea
This project combines modern data analysis tools, web technology, and real-time environmental data to build an interactive Sea Level Map focusing on the North Sea, the English Channel, and parts of the Atlantic Ocean.
Key Components & Tech Stack
- Data & APIs: Real-time gauge station data processed via Python.
- Database Management: SQLite for structured data handling.
- Visualization & UI:
- Plotly & Dash for interactive data charts and dashboard controls.
- Pydeck and Carto wrapped around OpenStreetMap for spatial rendering.
- Deployment & Infrastructure:
- Astro for the web frontend framework.
- Nginx web server running on Ubuntu Linux.
- Cloudflared for secure tunneling and hosting.