01 // The river
Almost untouched
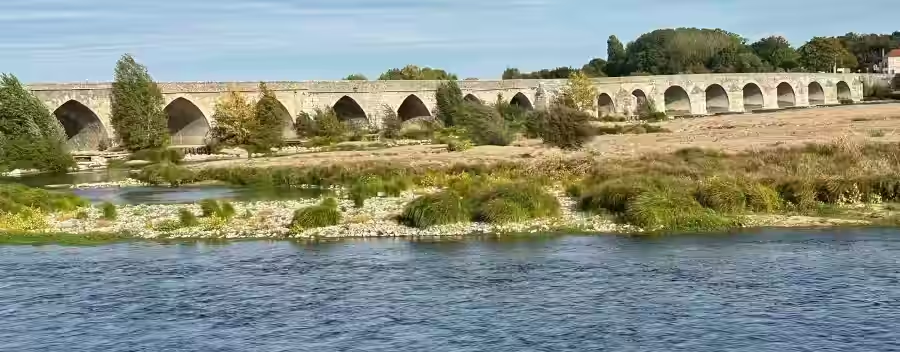
The Loire, one of the last almost untouched rivers of central Europe, is strikingly beautiful. The best way to see it is to walk a few kilometres along the bank and notice the variety of plants, animals and landscape on offer. The air is full of the whir of insects, the song of birds, the scent of poplars, grasses and wild flowers. Everything lives, moves and breathes with the rhythm of the Loire’s constantly changing course. Pioneer plants grow, then the next flood tears them away or buries them under the typical sandy sediment.
02 // Summer 2026
Short of water
The châteaux of Chambord and Sully are world-famous and draw millions of people to this very distinctive region every year. On one of my walks in the large woodlands near these fairy-tale castles, I noticed how short of water the place was. Every meadow and verge was dried out and yellow, there was little water in the Loire — the leaves on trees and bushes looked limp and wilted. One does not immediately think of climate change, fair enough. It moves me and it interests me, so I start looking into it. Météo-France, the French national weather service, analyses these developments as well and has declared summer 2026 the warmest summer since climate records began in 1900.
03 // Records
Climate and groundwater data
What interests me first, in answering the question in my head, is of course climate-relevant environmental data. Without meaningful measurements one quickly becomes a teller of fairy tales. Water is the basis of all life, it matters, and so people keep books, measure and document rainfall, air temperature, wind and groundwater with great care, to name only a few important quantities. It is extremely helpful that in 2026 such important data are digitally available, almost without limit, and can be used. Météo-France released the data to everyone in 2023.
Once a problem is recognised and understood, the next step is to work on a strategy for a solution. So I look first for climate and groundwater data. At meteofrance.fr you are in the right place at once. So I load time series of precipitation, wind and temperature within 100 km of Orléans into a new local SQLite project database, in order to carry out analyses. Groundwater data come from hubeau.fr. The data are heterogeneous, so processing and selection are required. The station with the longest series in the area that interests me is called Trancrainville and lies about 29 km north of Orléans. That is far enough from the city to avoid being influenced by the city itself.
I now have meteorological data from 13 October 1965 — ideal. The world was still more or less in order then. Air temperature is of course not constant through the day. So that values from different days can be compared, readings are taken several times a day, always at the same hours, and a representative daily mean is formed from them. The temperatures in the chart that follows are weekly means, themselves built from daily means.
Until 31 December 1992 the temperature was measured every 3 hours, eight values in 24 hours, at 00, 03, 06, 09, 12, 15, 18 and 21 UTC (UTC: Coordinated Universal Time). From 1 January 1993 a value was written every hour. Any mean you like can be formed from these single readings. I chose weekly values so the chart stays readable. In this form the data are less scattered, and patterns — the typical rise in spring, for example — are easier to see. The chart shows the temperature curve for the whole period of almost exactly 61 years. Tip: simply move the mouse pointer over the chart. That makes it a little larger and much easier to read.
04 // Temperature
Weekly means over 61 years
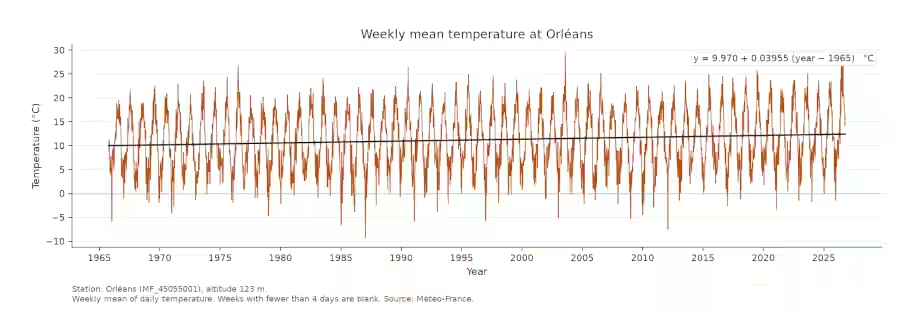
What looks unspectacular at first glance shows quite well how sluggish the atmosphere is. If you want to know how the long-term mean temperature changes, you can, for example, lay a straight line of best fit over the readings. At the top right of the chart the equation of that line is given, with a slope of 0.03955, which means nothing other than that the mean temperature will rise by 3.96 degrees Celsius in 100 years. The method extends the line beyond the period that was actually measured, since only 61 years have been recorded. A linear behaviour of natural relationships is, besides, the exception. The great majority of climate scientists expect a more serious course. In their view, in 2061 — 100 years after the records began — the temperature difference will lie higher than the 3.96 degrees calculated here. Frost days in winter will then be the exception. Even if we do not believe that, 61 years after recording began we already have an actual rise of about 2.6 °C. What can be done with that number? Is it serious? The answer comes further down.
05 // Precipitation
Less water from above
First, the rain. These data also come from meteofrance.fr. For precipitation there are daily values up to 31 December 1992, and hourly values after that. A discussion of whether rainfall intensities have changed is therefore not straightforward. Daily and weekly totals exist and are reliable. For the sake of clarity I calculated three-month totals from the weekly values, which does not affect the trend. Plotting the data together with their linear trend gives the following chart.
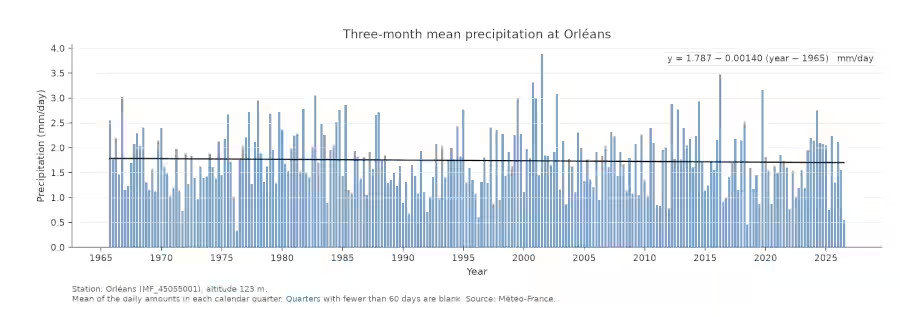
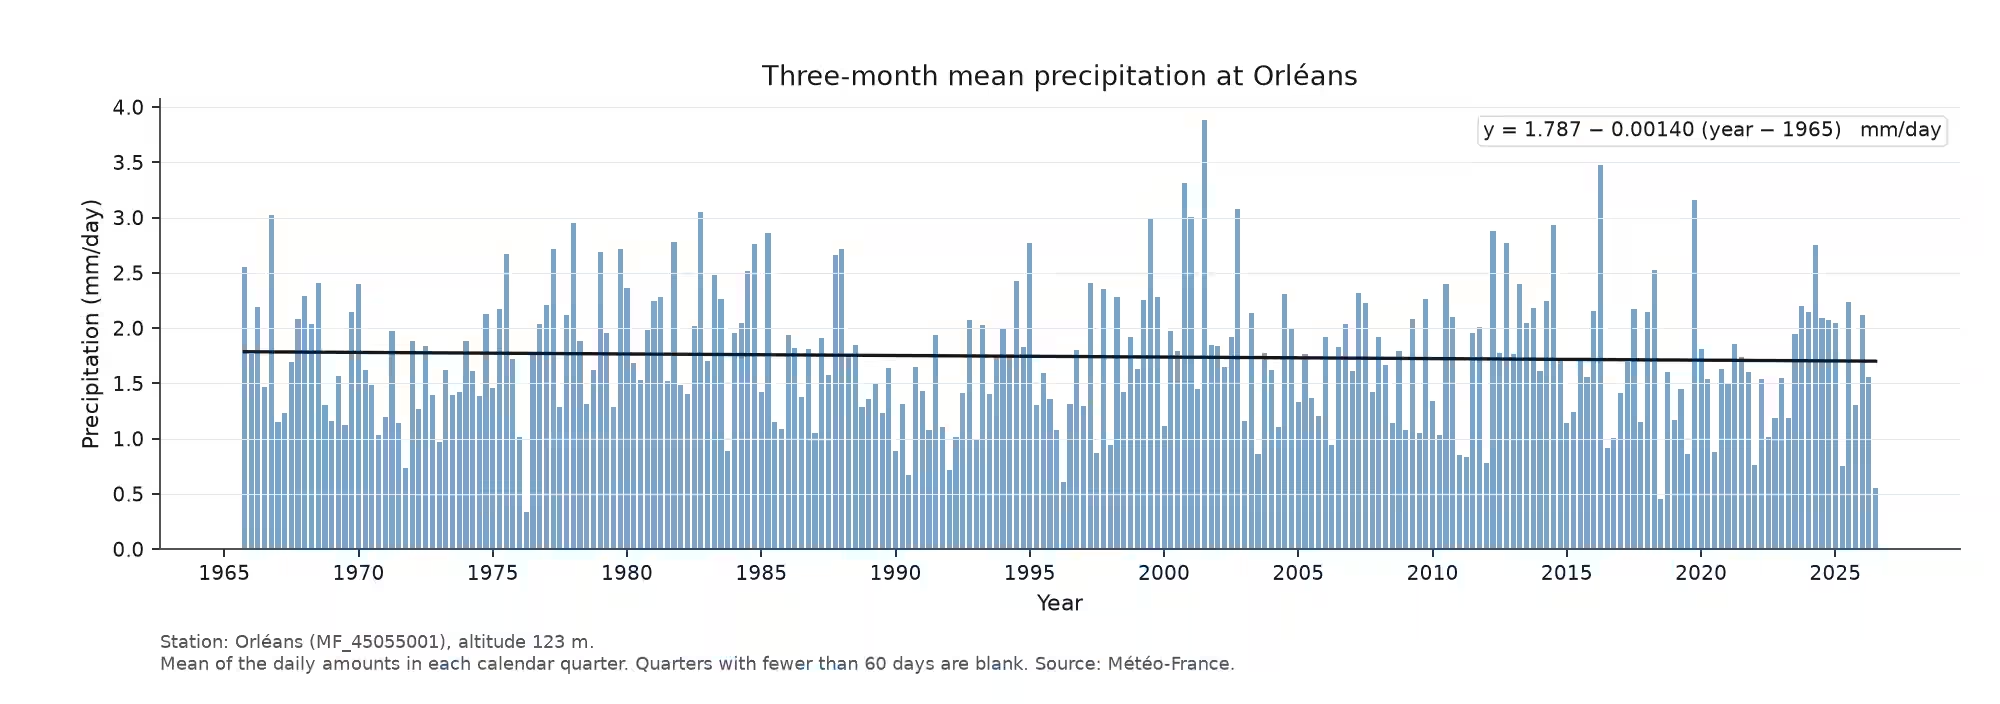
Here you see the linear trend line with a slightly negative slope. That means less rainwater is measured in the long-term mean. If I were a meteorologist and not an engineer, I might say at once that this is because of the warmer air through which the rain falls today. In the end the result is what counts, and that means: less water falling from above onto everything below. Plotting the yearly precipitation totals at Orléans gives numbers that some of us have come across before: the mean annual precipitation at the Orléans station, on the basis of the available series from 1965 to 2026, is 637.2 mm/a. That means if all the water of one year neither ran off, soaked in nor evaporated, that would be a water depth of 63.7 cm — most of us could still wade through it comfortably.
The water does not of course stay put when it falls to the ground as precipitation. It meets trees, meadows, soil, cars — everything that is there. On a sealed surface such as a house roof or a road, the first drops cling to that surface until it is wetted through. Only then does the water start to run off under gravity. A tree in the city has, relative to the ground it stands on, a great deal of surface in its leaves. When it rains, they become wet, cool the air and give off a pleasant scent. Water that reaches the sewer is more or less lost to this cooling of the air. Trees in the city are living, aesthetic air conditioners. In short: a good thing.
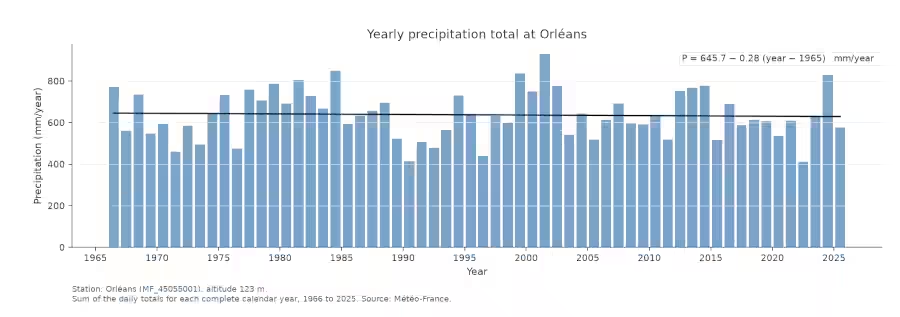
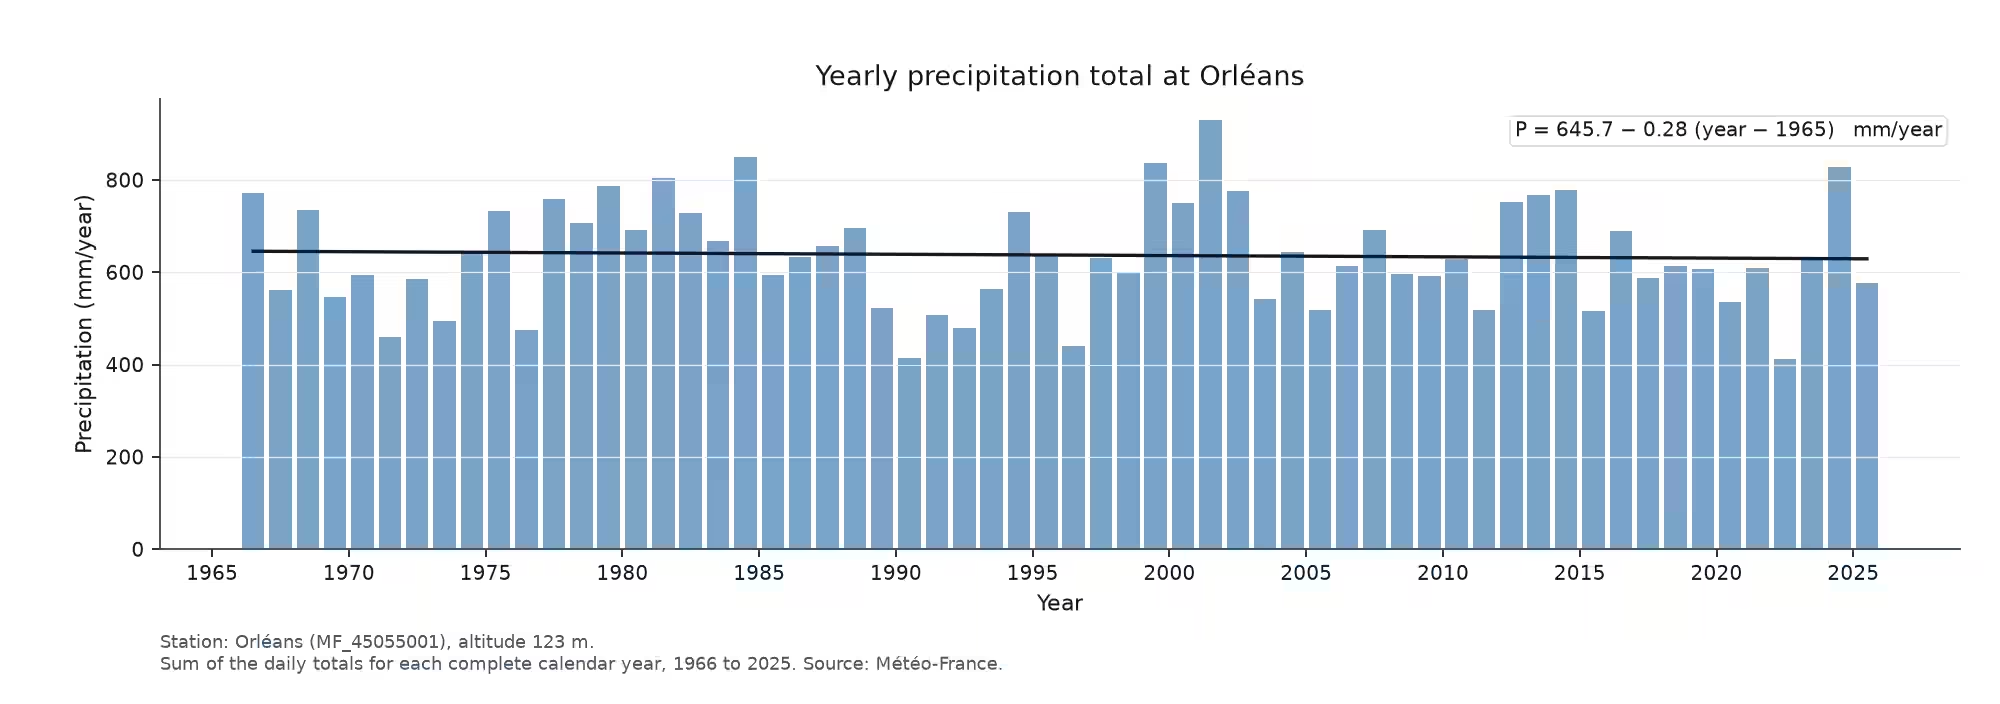
Because precipitation declines, as shown above, the yearly precipitation totals decline as well: by 28 mm on average over 100 years. In reality this is not much; a decent thunderstorm usually already has more intensity. To understand the dryness, we simply have to dig a little deeper.
06 // Groundwater
The store beneath the ground
All plants need water, which they usually take from the soil through their roots. The process is, like much in nature, a small wonder, because plants use capillary rise. Capillary action is why a coffee filter becomes wet at the top even though it is not in direct contact with the water. Every plant has a certain height above ground and a rooting depth below, with small departures set by the conditions at the site. Plants stand mostly in soil, and that soil may be sandy, loamy, peaty, shot through with stones, or a mixture of all of these. Look closely and there are small gaps between the more or less fine grains. Those gaps are called pores, and the volume they occupy together is the pore space. Think again of the coffee filter and it is clear that the soil, with its structure, also has a capillary action: the fine pores can draw water upwards against gravity. The coarser the grains, the less capillary the soil. On the other hand, coarse soils such as sands are good at moving water quickly from the surface into the groundwater. Groundwater is an extremely important part of the water cycle which, unlike rivers, can store water in large quantity and, through the soil filter and the cool temperature, in high purity. Without groundwater, life as we know it would be completely different and simply unthinkable. So let us look at the groundwater level 30 km north of Orléans.
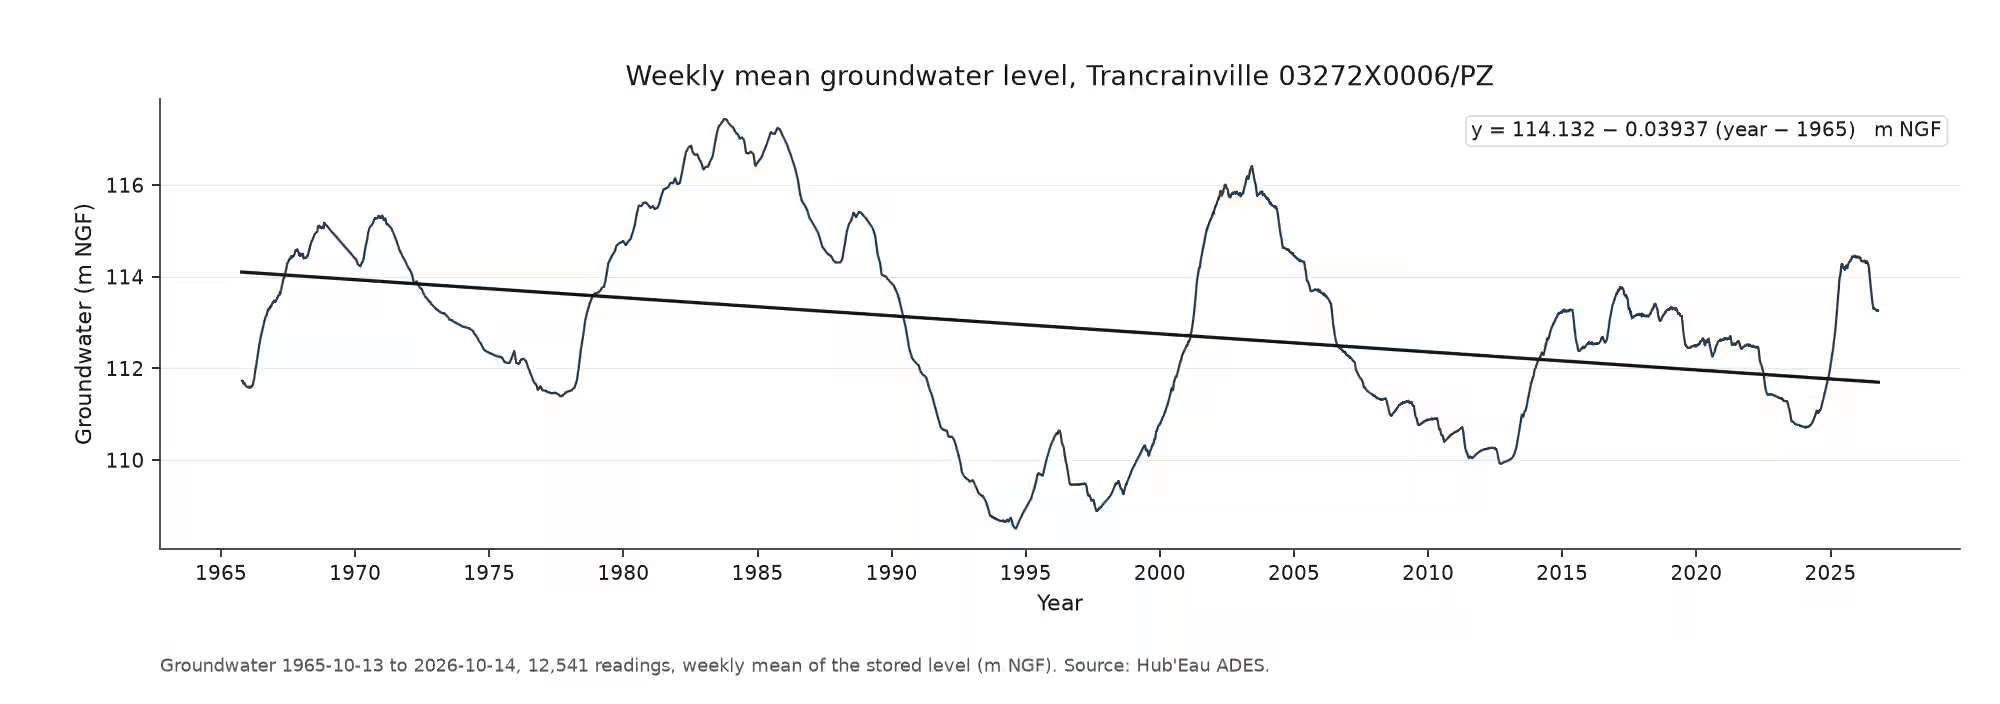
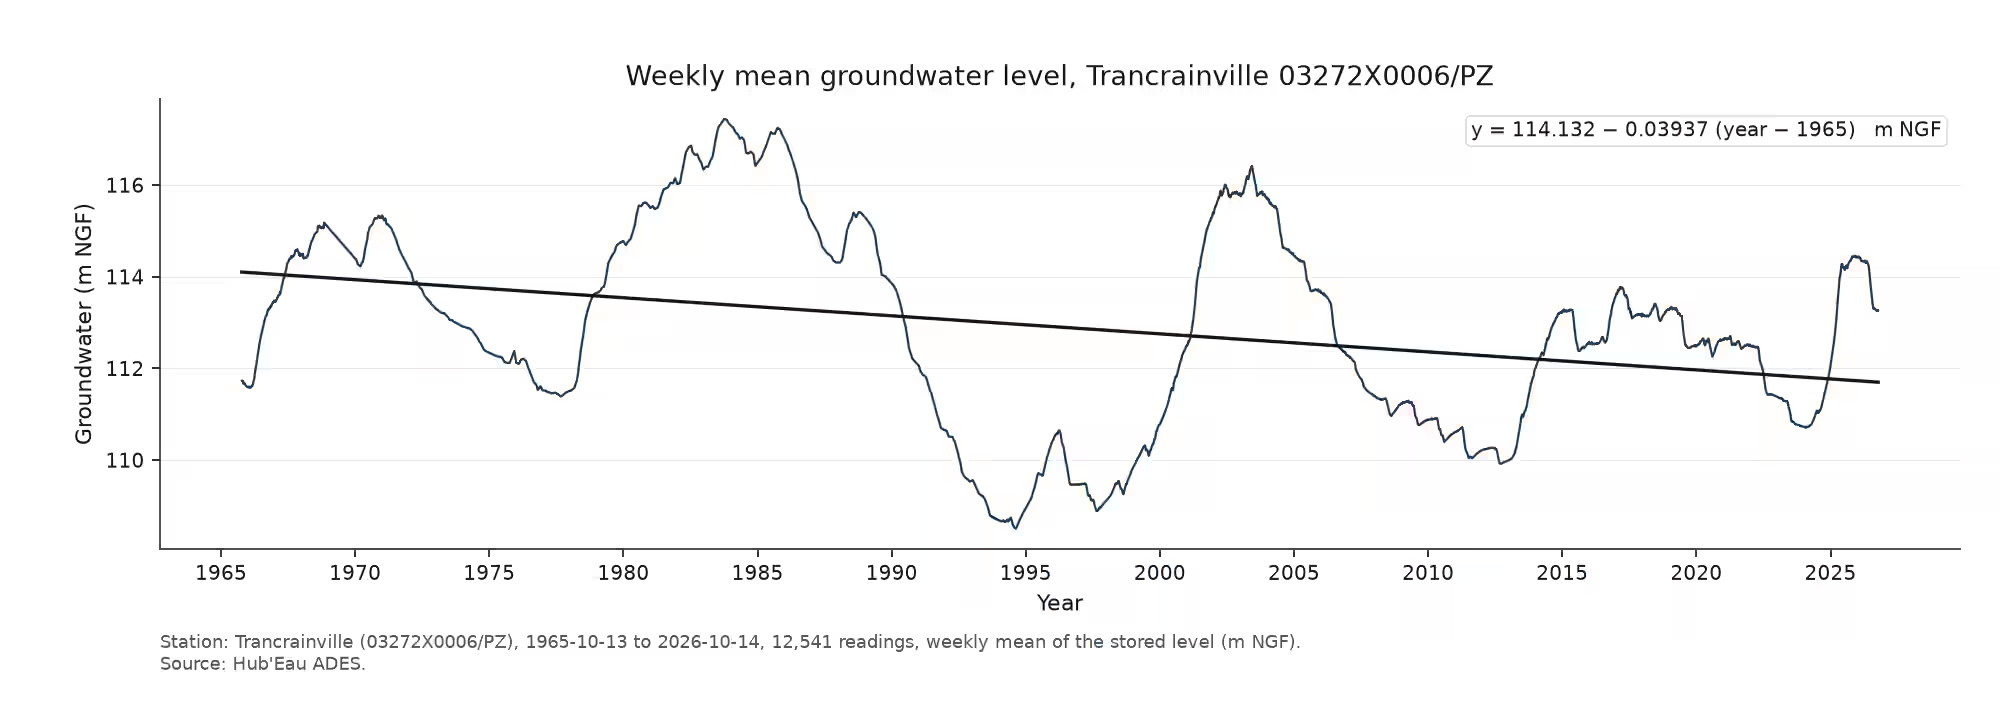
You see at once that the groundwater level falls over the same 61 years. These are measurements, so there is almost no room for belief or doubt. The linear trend shows a drop in the groundwater level at Trancrainville of 3.94 cm per year — about 2.4 m since records began at this place, or almost 4 metres in a century.
07 // Consequences
What grows at the surface
What follows from this? Groundwater for drinking water is usually pumped from greater depths. The extra lift hardly shows in ordinary water prices. Everything that grows at the surface, though, has a certain need for water. Plants meet it from the soil with the help of their roots. If the groundwater level falls, as it does here, plants have less and less water for normal growth. Less growth turns directly into less plant mass. In a prolonged drought the plant dies. For field crops, yield losses or the total loss of a crop are real consequences. Artificial irrigation helps locally, but it costs energy and money in its turn, and so it is used only for crops that promise a return. Natural stands, clumps of bushes, groups of trees and woods are habitat and, at the same time, a refuge for animals. Under a development like this they come under increasingly high pressure.
08 // Evaporation
Warmer air is thirstier
Should we carry on as before, change nothing, and hope for nature’s power to heal itself? The best answer is a look at the temperature, precipitation and groundwater already shown. Temperature goes up and, at the same time, it rains less. Less rain alone, with the same land use, already means falling groundwater levels, because less water finds its way into the groundwater. The really large problem, though, is the rising temperature and the higher evaporation that sets in because of it. The driving force for evaporation from an open water surface or a moist soil is the saturation deficit. It sounds complicated and it is simple. Depending on its temperature, air can hold only a certain amount of water. Once that limit (100%) is reached, evaporation stops. Relative humidity, which any ordinary home weather station or the news can tell you, says exactly how close the air is to that limit. Because the air is rarely fully saturated, water can evaporate continuously. The decisive point: the warmer the air becomes, the greater its ‘thirst’ (the saturation deficit) — and the faster and more strongly water evaporates from soils and water bodies. Physically, the capacity of air to hold water grows by about 6–7% per degree Celsius. An example makes this clearer.
Two basins of water, 50% relative humidity, no wind:
- Basin A with an air and water temperature of 20 °C.
- Basin B with an air and water temperature of 25 °C.
In 24 hours, 3.2 mm evaporate from basin A and 5.5 mm from basin B. We almost always have some air movement, and a wind of only 3–5 m/s changes the picture sharply. Basin A (20 °C) loses 8.5–10 mm and basin B (25 °C) loses 14–16.5 mm in 24 hours. That is 65% more evaporation in the presence of wind. You can argue the details back and forth, but in every case it means less groundwater recharge.
Developments like the ones shown at Orléans exist all over Europe. Understanding the problem is the first step. Carrying on as before is at least two steps backwards.